How many of the world’s research articles can be read for free by anyone anywhere? This “opening” of the scholarly record is a herculean task of global importance for research and society, being championed by groups around the world from universities to libraries, governments, research funders and publishers.
For clarity sake, “research articles” are the accumulated body of research in every field—history, physics, medicine—usually (but not always) published in peer-reviewed academic journals like Nature, Science, and PLOS ONE and/or deposited in discoverable research repositories (see the note regarding books and manuscripts at the end of this brief).
How much progress have we made, and how much is left to accomplish? The short answer is that it depends on a number of factors, including definitions, sources, time periods considered, location, language, and discipline:
- Definitions: There is no broad, multi-stakeholder consensus about what “open” or “open access” (OA) means, so every research paper, briefing, and declaration describes these terms a little differently (see OSI Issue Brief 1). These terms are also used inconsistently: Some prefer to say “open” and others prefer “open access” while still others use these two terms interchangeably or consider them to be different kinds of products. Added to this, in scholarly communications settings these products have color-coded gradations like gold and bronze that can also be variously interpreted. This variability leads to a range of findings for how fast open is growing. OSI considers these varying uses as evidence that open—as an evolving, multi-community-owned concept—exists along a spectrum. In this brief, we use the term open (instead of open access) to describe this spectrum.
- Sources: Figuring out which articles to include (and how) in open calculations is another important consideration. Some databases attempt to track all scholarly journals; others track only select journals (identifying which journals cover actual research and not pseudoscience, which ones do peer review, which ones are active, and so on); and still others just track articles without regard to journal affiliation. All of these databases are incomplete in their own way, particularly with regard to excluding too many non-English, non-Western publications. Sampling methodology is also important because most studies sample the data and don’t count every single article. Table 1 shows journal and article counts from some of the more widely-used databases (there are other indexes as well and also smaller regional indexes that cover non-Western and non-English journals). None of these estimates are definitive, and they keep growing by a few percentage points every year (see Larsen 2007 and 2018 STM report) as research increases, as new specialties emerge, and as “publish or perish” pressures in academia persist.
TABLE 1: DATABASES COMMONLY USED TO ESTIMATE THE GLOBAL TOTAL AMOUNT OF OPEN
| Database | Number of journals included | Number of new journal articles added annually | Total number of journal articles included | Notes |
| 1findr | About 90,000 journals, of which at least half are active (Archambault 2018a) | About 3.5 million (Science-Metrix 2018) | About 87 million | Science-Metrix estimates there are 100-140 million journal articles counting every article published since the year 1665 (Archambault 2018a). |
| Crossref | About 60,000 journals | About 3 million (Piwowar et al. 2018) | About 67 million | Tracks articles using digital object identifiers (DOIs). Note that only about 60% of Crossref’s listings are academic journals (Archambault 2018a) |
| Dimensions | n/a | About 3.5 million (Science-Metrix 2018) | 138 million “various research-related data sources” (Dimensions website) | This is a very new resource, launched in early 2018. |
| Directory of Open Access Journals (DOAJ) | 12,191 open access journals as of 10/19/18 | At least 350,000 annually (Laakso 2012) | About 3.4 million as of 10/19/18 | This is a select, global database of open journals that meet strict standards for quality and transparency |
| Google Scholar | n/a | n/a | About 100 million | Khabsa & Giles 2014 estimate there may be as many as 114 million “scholarly documents” on the web in English alone, of which 100 million are indexed by Google Scholar. |
| Scopus | About 22,800 (Scopus website) | About 2.5 million (Plume 2014 and Archambault 2018b) | About 69 million records of all types—journal articles, books, editorials, more (Scopus website) | Has strict inclusion criteria and expert curation, so is more likely to include only the most significant academic journals (and also more likely to undercount newer and less established journals). |
| Ulrich’s | About 42,000 active, peer-reviewed scholarly journals in all languages published worldwide | n/a | n/a | Primarily uses ISSNs to track journals (international standard serial numbers) |
| Web of Science (WoS) | About 19,000 journals (2018 STM Report) | About 1.5 million (Science-Metrix 2018) | 151 million records of all types–journals, books, and proceedings (WoS website) | Strict inclusion process (see Scopus note, above) |
| Web of Science core* | 20,300 journals, books and conference proceedings (WoS website) | n/a | Over 71 million records of all types (WoS website) | Strict inclusion process (see Scopus note, above) plus more thorough coverage of the most globally significant journals than WoS. |
| wizdom.ai | About 73,000 (2018 STM Report) | Unknown | About 90 million “publications” (wizdom.ai home page) | Comprehensive database including patents, articles, datasets, more |
Note: The Web of Science Core Collection currently includes the Science Citation Index, the Social Sciences Citation Index, the Arts & Humanities Citation Index, the Conference Proceedings Citation Index, the Book Citation Index, and the Emerging Sources Citation Index (ESCI).
- Time periods: Open has been growing steadily, so estimates made at different time periods can be quite different. Laakso 2011 notes that open started growing in the early 1990s at double-digit annual growth rates and reached 1% of the global total by 2004 (Bjork 2004). Today, somewhere between 20 and 30 percent of scholarly journal articles may be immediately available in some form of open—perhaps even more. Which time periods we consider makes a big difference in our calculations (see Figures 1A and 1B).
FIGURE 1A: JOURNAL ARTICLES INDEXED, 1970-PRESENT
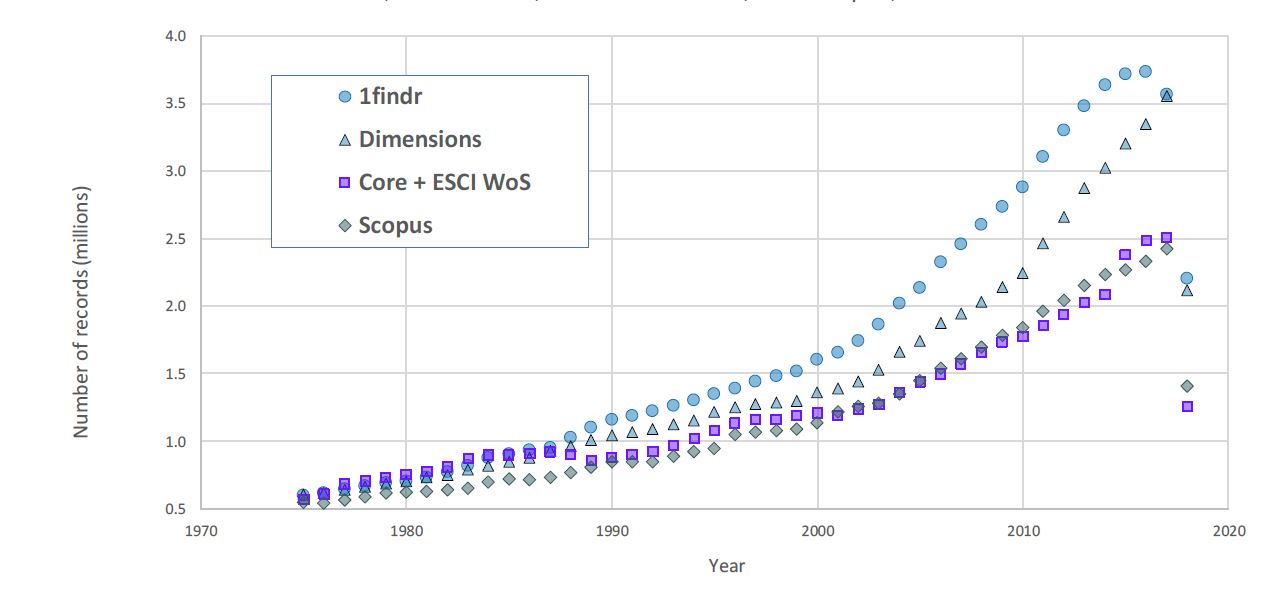
Source: Archambault 2018b.
Note: “Core+ESCI WoS” refers to the core WoS collection plus (see Table 1 note) plus the WoS Emerging Science Citation Index (ESCI). At the time of the publishing of this brief, ESCI is included in the WoS core; hence, “Core + ESCI WoS” is redundant.
FIGURE 1B: JOURNAL ARTICLES PERCENT OPEN, 1970-PRESENT
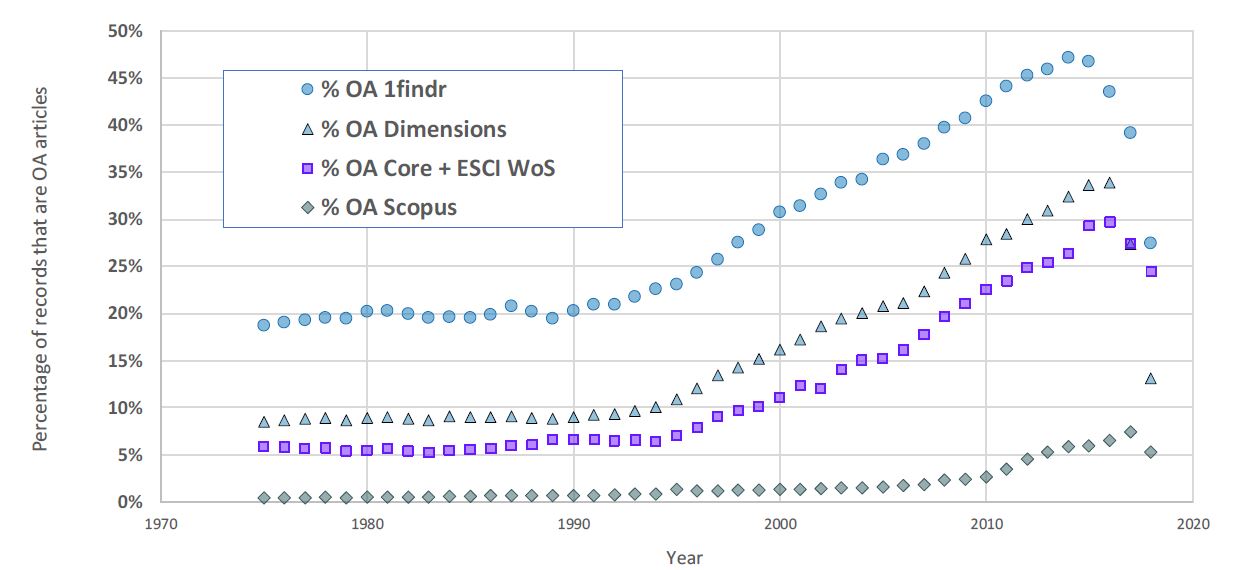
Source: Archambault 2018b.
Note: See note for Figure 1A.
- Location: Different countries have widely different publishing volumes and open access publishing rates (generally speaking, emerging economies have a far higher percentage of open journals than developed economies; see Archambault 2018b). Global averages aren’t telling since rapid progress in some parts of the world may mask the lack of progress elsewhere.
- Language: Around 80% of the journals indexed by Scopus are published in English, but the fastest growth in open may be coming from low-cost, rapid-turnaround journals who cater primarily to local researchers in languages other than English, and many of these non-English journals are not indexed, yet (i.e., not counted in official global totals) due to a variety of reasons (Shen 2015). For instance, these journals may be too new or too small, they may lack DOIs, the indexing authorities may be unfamiliar with non-Western research and researchers, and/or these journals may not meet various other criteria considered in calculations of journal publishing integrity.
- Discipline: Some fields like physics and astronomy have permitted unfettered and immediate access to research for years, using preprint platforms such as arXiv (pronounced “archive”) as their primary publishing vehicle. Some other fields—chemistry is one such example—have historically been much less open. Some new areas of research may be born open because it makes sense; others may struggle because one-size-fits-all open solutions aren’t a good fit. Here again, aggregate numbers don’t tell the full story.
- Sub-factors: Other important information about open growth and trends may be lost inside these aggregate numbers, however calculated. For instance, we know that research output varies by author age and position (Abramo et al. 2015, Kristoffer 2014). How is this important (or is it)? We also know that the vast majority of the most highly-cited academic papers come from only 1% of authors (Ioannidis et al. 2014). What does the publishing perspective of the 1% look like and how is it changing? Institutional affiliation also makes a difference given the wide variation in emphasis and capacity between institutions (Siler et al. 2018 scratches the surface of this issue). And then there’s the influence of cash rewards on publishing choices, the influence of deceptive publishing on open growth, patterns of noncompliance with open mandates (Research England 2018), and much more. Only by better understanding all of these influences can we truly understand open trends and devise workable policies to improve open.
So, taking all these caveats into consideration, what do we know? What can we know? We need to look for comprehensive studies that recognize the breadth and complexity of the open landscape and investigate the full spectrum of open products, have rigorous sampling methodology, and temper their conclusions. Three recent studies do this better than others and are cited heavily in this brief. The first of these—Piwowar—looks at open across three different databases and time periods using Crossref, WoS, and an open access website called Unpaywall (see Table 2):
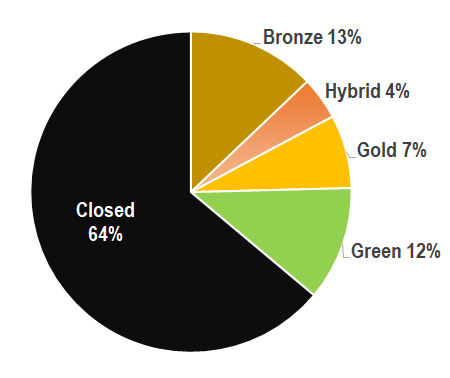
TABLE 2: PIWOWAR 2018 ESTIMATES OF AMOUNT OF OPEN ACROSS THREE SOURCES
| Type Of Open | Crossref DOIs: All Journal Articles With Crossref DOIs, All Years | WoS DOIs: All Citable WoS Articles With DOIs, 2009–2015 | Unpaywall DOIs: All Articles Accessed By Unpaywall Users Over A 1-week Period In 2017 |
| Open (all types) | 27.9% | 36.1% | 47.0% |
| Bronze | 16.2% | 12.9% | 15.3% |
| Hybrid | 3.6% | 4.3% | 8.3% |
| Gold | 3.2% | 7.4% | 14.3% |
| Green | 4.8% | 11.5% | 9.1% |
| Closed | 72.0% | 63.9% | 53.0% |
Source: Adapted from Piwowar et al. 2018
Here, bronze, hybrid, gold and green refer to different types of open (see OSI Issue Brief 1), and closed means subscription-based access only or otherwise hidden from view. Bronze open — where articles are hosted on publisher websites, with or without delay or CC-BY licenses — doesn’t align with many definitions of open (for OSI, however, it’s a type of open that falls on the open spectrum), so if we subtract bronze from these numbers, the total open in this table would be 11.6% in column one (Crossref), 23.2% in column 2 (WoS), and 31.7% in column 3 (Unpaywall). Note also that a lot of green doesn’t align with a single definition either (green onpen can be embargoed and/or copyrighted — see PubMed Central).
Graphing the CrossRef sample over time (and again taking into account the limitations of this sample), it’s clear — noting the similarities with Figures 1A and 1B derived by Archambault— how both the number of journal articles (Figure 2A) and percent open (Figure 2B) have trended markedly upward since around the late 1990s. In general, Piwowar estimates that considering the full historical body of scholarly literature (sampling about 19 million records in total), about 28% of the global scholarly record is now available in some form of open (depicted by the total gray area in Figure 2B), with increasingly higher open rates in recent years driven by the growth of gold and hybrid forms of open.
FIGURES 2A & 2B: HISTORICAL GROWTH OF CROSSREF’S ARTICLES AND OPEN CONTENT
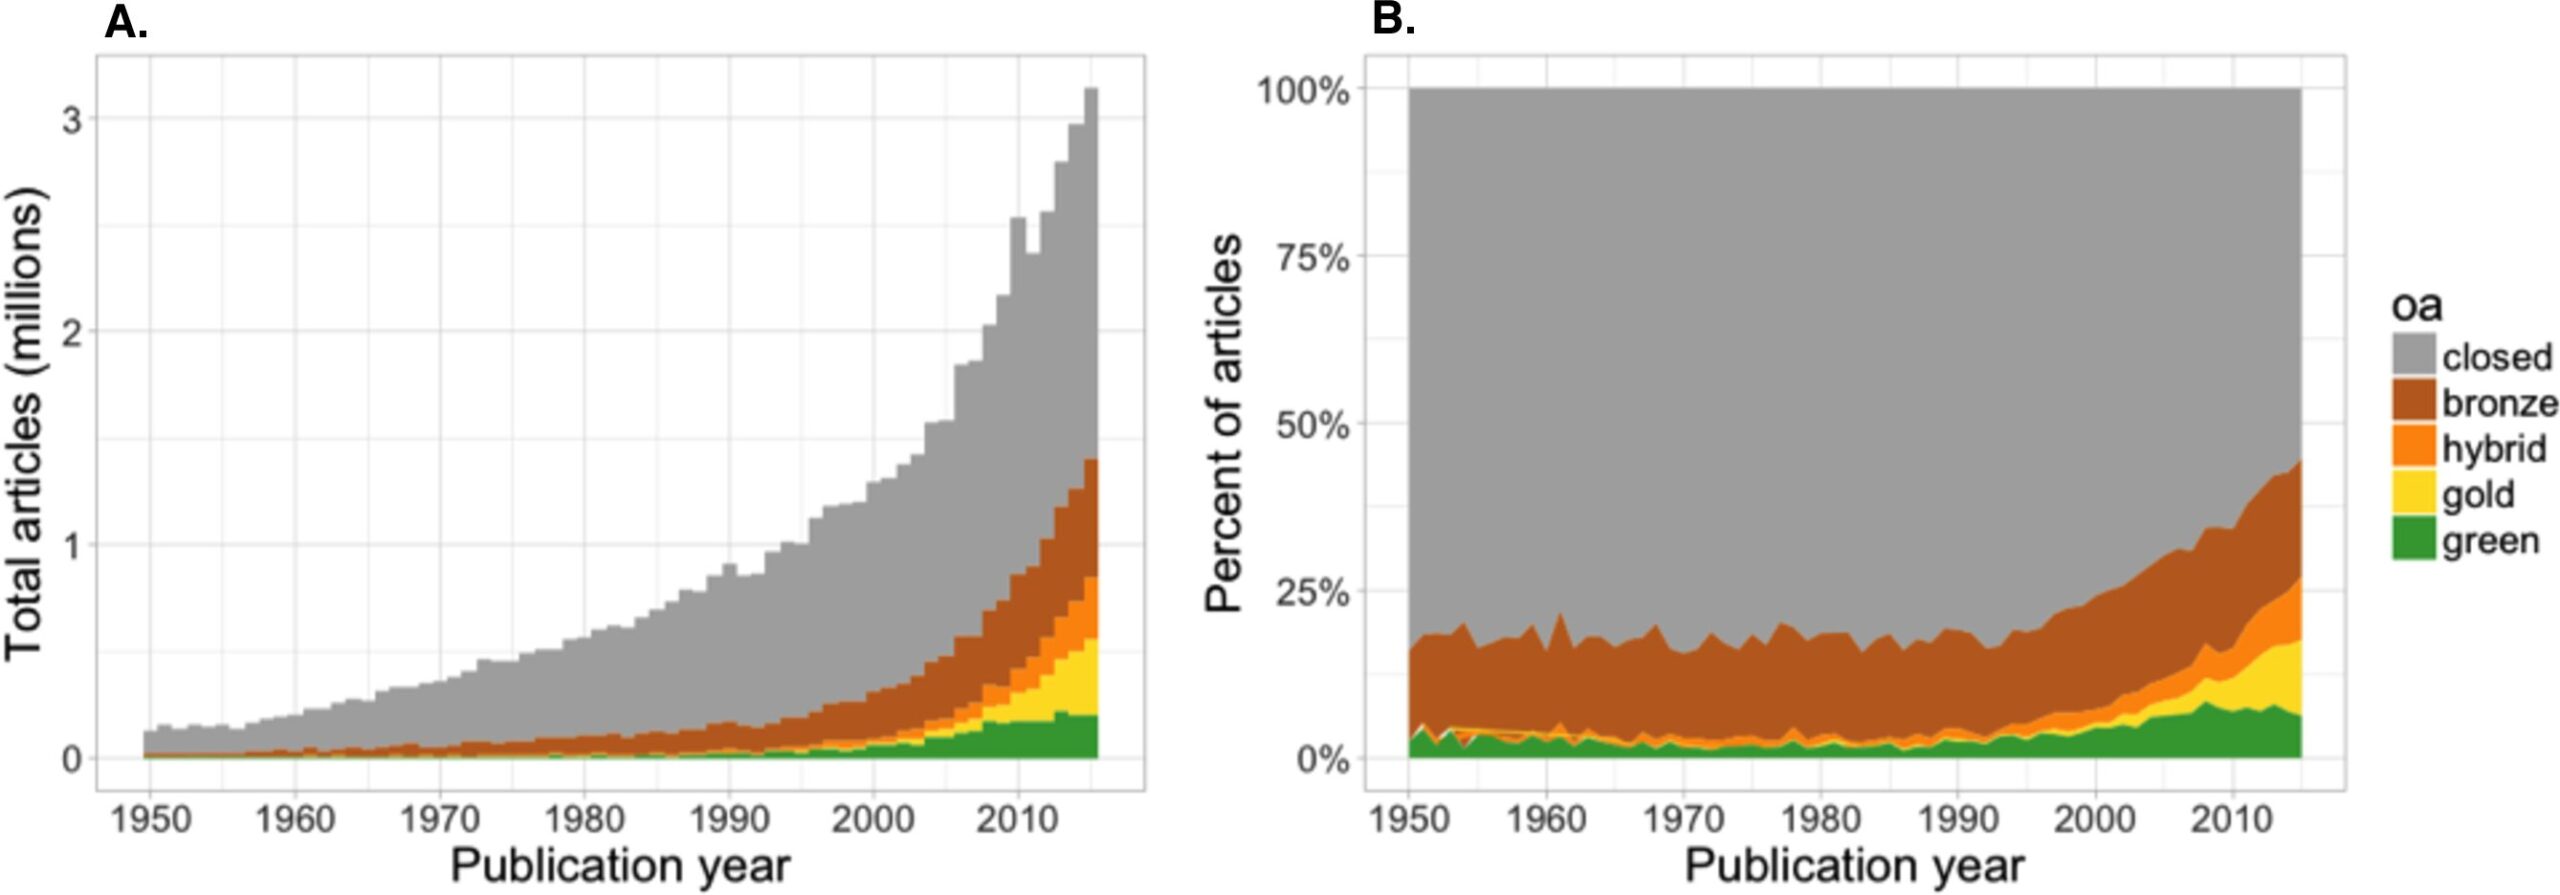
Source: Piwowar et al. 2018
Note: See note, Table 2
Archambault et al. 2014 and Science-Metrix 2018 are the other two comprehensive studies to consider. In these analyses, open publications (again, considering the full spectrum of open products) may now account for around 55 percent of the annual global totals, with the exact percentage varying by country, discipline, domain, database, and type of open considered (see Table 3). These open totals are higher than in Piwowar because the DOIs used by Crossref and Unpaywall to track articles are fairly recent and not yet universally adopted. Using a broader sample, Science-Metrix (2018, p. 6) concludes that “the vast majority of the large scholarly publishing countries have more than 50% of their articles published from 2010 to 2014 freely available for download [in some form of open].” This isn’t the end of the story, though. Archambault 2014 also calculates that significant “backfilling” of the scholarly record is now occurring, where open totals continue to increase as embargo (i.e., non-subscriber blackout) periods expire, journals “flip” from subscription-based to open, older articles are otherwise made public, and green repositories continue to improve. All this activity may be adding around 4% per year to our former calculations of open totals.
TABLE 3: OPEN VARIATIONS BY REGION, TYPE AND DOMAIN, 2014-15
| By region | Number of journal articles published | % open (all types), 2015 | By type of open | % open (all types), 2014 | By domain | % open (all types), 2014 |
| World | 1,490,237 | 55% | Total | 54.8% | Total | 55% |
| United States | 397,773 | 63% | Green | 31.5% | Health sciences | 59% |
| China | 281,277 | 46% | Gold | 23.3% | Natural sciences | 55% |
| United Kingdom | 111,666 | 67% | “Green-gold” | 6.9% | Applied sciences | 47% |
| Germany | 104,695 | 57% | Unknown | 12.4% | Economic & social sciences | 44% |
| Japan | 78,193 | 50% | Arts & humanities | 24% |
Source: Data combined from several tables in Science-Metrix 2018 (using the WoS + 1science database).
Note: The types of open noted here are not mutually exclusive. Also, there is a discrepancy between the prevalence of “bronze” open noted in Piwowar and Archambault, maybe owing to how this type of open was defined by each researcher. As noted in the body of this paper, even amongst experts, there is no standard about how to exactly define each of these different types of open.
TABLE 4: SUMMARY OF CURRENT, APPROXIMATE STATE OF OPEN
| Number of active, peer-reviewed scholarly journals in the world today | Number of new scholarly articles published each year | Percent of new articles available in open format (all types of open) | Percent of new articles available in open format (green and gold only) | Total number of scholarly articles in the world today | Percent of total number of articles open (all types of open) |
| 40,000-90,000 (Table 1, Figures 1A, 1B) | 3-4 million (Table 1, Figures 1A, 1B) | ABOUT 55% (Table 3) | 23-42% (Tables 2, 3) | 80-100 million (Table 1) | ABOUT 28% (Figure 2B) |
There are many nuances to all this data, of course, and readers interested in learning more are encouraged to read the studies listed in the reference section of this brief. But generally, what we know about the growth of open from these and many other studies to-date can be summarized as follows:
- A large percentage of scholarly articles can now be downloaded for free.
- The trend toward open is increasing, especially with newer articles.
- Backfilling is making more and more of the historical research record available.
- Expressing the global growth rate of open as a single statistic may not help measure our progress because:
- Our measurement tools are inadequate. We have no single, stable instrument with which to precisely measure open, especially over time;
- different types of open have increased at different rates across different regions and disciplines;
- calculations of open vary widely by time period considered, databases used, research methodology and tools, and how open is defined;
- distributions are skewed (for instance, nearly half the growth in green open since 1950 has been concentrated in just two repositories—arXiv and PubMed Central; see Piwowar et al. 2018, appendix);
- We aren’t looking at the full range of research outputs right now. Bornmann and Mutz 2014 argue that simply counting what gets indexed in databases like Scopus undercounts the real growth of research—we should also be counting open datasets and other outputs.
- There are types of open we need to understand much better. These have a variety of names that aren’t commonly recognized or widely understood (such as bronze open; see Table 1). We’re simply not sure exactly how rapidly the different output formats of scholarly publishing are changing and why.
Finally, there is an emerging consensus that the illicit universe of journal articles on sites like SciHub and ResearchGate shouldn’t be counted as progress toward achieving open. Given that these articles are often illegally posted and hosted (Jamali 2017), there is widespread concern about the persistence of this content, as well as the sustainability and ethics of these practices (Fortney and Gonder 2015).
WORK THAT NEEDS TO BE DONE
More research is needed to better understand:
- the current growth of publishers and journals—how many exist, how many are legitimate, how many are deceptive (see OSI Issue Brief 3 on deceptive publishing), and possible barriers to future growth.
- what types of open are growing faster than others and why;
- what the current system needs in order to ensure open’s continued growth while at the same time serving research and safeguarding the scholarly record; and
- access issues for researchers in all regions of the world, particularly with regard to the current system. Earlier in this brief, for instance, we described “closed” as “subscription-based access only or otherwise hidden from view.” This is a big range of outputs. How much subscription-based content is inaccessible and to whom, and how successful have efforts been (like Research4Life) in providing needed access? What other access gaps exist? How much of these gaps are “tangible” (for instance, how many pancreatic cancer researchers can’t access the studies in their field)? What are we doing and what can be done to daylight “dark” information that is neither open nor subscription-based? How much of this is information should be daylighted?
- Also earlier in this brief we noted a host of poorly-understood peculiarities, such as that most highly-cited academic papers come from only 1% of authors, publishing differences between institutions, cash rewards or publishing, patterns of noncompliance with open mandates and more. We need to understand all of this better.
Coordinated international action is needed to:
- improve the integrity and capacity of newly emerging journals;
- improve the indexing of journals, especially those that are newer and publish in languages other than English;
- improve open for institutions and regions with fewer resources;
- improve open for all academic fields and disciplines;
- protect the integrity of the scientific record from deceptive publishers;
- agree on a standard vocabulary to describe open; and
- recognize the open spectrum as a better way of capturing the wide range of open outcomes we need to track.
ORGANIZATIONS AND EFFORTS FOCUSING ON THIS ISSUE
- A wide variety of researchers are involved in examining the growth of open, some who are noted in the reference section at the end of this brief.
- There are many organizations involved in tracking and indexing scholarly journals. The ones highlighted in this brief are Elsevier (which runs the Scopus database), Clarivate (which operates WoS), ProQuest (which operates Ulrich’s), Crossref, 1science (which runs 1findr), Digital Science (Dimensions), Informa (wizdom), and DOAJ.
- A very wide variety of open organizations are involved in advocating for open reforms. See the OSI participant list (at osiglobal.org) for a small sample of the leading organizations in this space.
- Nonprofit organizations such as the Public Knowledge Project (or PKP, which provides the Online Journal System—OJS) and the Center for Open Science (COS) are at the forefront of developing open source software to improve the quality and reach of scholarly publishing.
- At the international policy level, there are no actors taking a leading role in this issue at the moment. Many countries have open policies, as do a significant number of international research funders, and there are examples of regional approaches that transcend national boundaries. However, there is no global coordination of these policies, or even widespread agreement about what direction to take.
REFERENCES & RESOURCES
- Abramo, G, CA D’Angelo, G Murgia. 2016. The combined effects of age and seniority on research performance of full professors. Science and Public Policy, 43(3).
- Archambault, É, D Amyot, P Deschamps, AF Nicol, F Provencher, L Rebout, and G Roberge. 2014. Proportion of open access papers published in peer-reviewed journals at the European and world levels–1996–2013. European Commission.
- Archambault, E. 2018a. Information provided directly to OSI in preparation for this brief.
- Archambault, E. 2018b. Universalisation of OA scientific dissemination
- Science-Metrix. 2018. Analytical support for bibliometrics indicators: Open access availability of scientific publications.
- Björk, BC. 2004. Open access to scientific publications – an analysis of the barriers to change. Information Research 9(2) paper 170.
- Bornmann, L and R Mutz. 2015. Growth rates of modern science: A bibliometric analysis based on the number of publications and cited references. JAIST 66(11), 2215-2222
- Davis, PM, and WH Walters. 2011. The impact of free access to the scientific literature: a review of recent research. Journal of the Medical Library Association: JMLA 99(3), 208-217.
- Fortney, K and J Gonder. 2015. A social networking site is not an open access repository. Office of Scholarly Communication. University of California.
- Ioannidis, JPA, KW Boyack, R Klavans. 2014. Estimates of the Continuously Publishing Core in the Scientific Workforce. PLOS ONE 9(7): e101698.
- Jamali, HR. 2017. Copyright compliance and infringement in ResearchGate full-text journal articles. Scientometrics 112(1):241-254.
- Khabsa, M, and CL Giles. 2014. The number of scholarly documents on the public web. PLOS ONE 9(5): e93949.
- Kristoffer, R, DW Aksnes. 2014. Publication rate expressed by age, gender, and academic position – A large-scale analysis of Norwegian academic staff. Journal of Infometrics 9(2).
- Laakso, M, P Welling, H Bukvova, L Nyman, BC Björk, and T Hedlund. 2011. The development of open access journal publishing from 1993 to 2009. PLOS ONE 6(6):e20961.
- Laakso, M, and BC Björk. 2012. Anatomy of open access publishing: a study of longitudinal development and internal structure. BMC Medicine 10:124.
- Larsen, PO, and M von Ins. 2010. The rate of growth in scientific publication and the decline in coverage provided by Science Citation Index. Scientometrics 84(3): 575–603.
- Piwowar, H, J Priem, V Larivière, JP Alperin, L Matthias, B Norlander, A Farley, J West, and S Haustein. 2018. The state of OA: a large-scale analysis of the prevalence and impact of Open Access articles. PeerJ 6:e4375
- Plume, A, and D van Weijen. 2014 (September). Publish or perish? The rise of the fractional author. Research Trends 38.
- Research England. 2018. Monitoring sector progress towards compliance with funder open access policies. Sector report RE-P-2018-05.
- Shen, C, and BC Björk. 2015. “Predatory” open access: a longitudinal study of article volumes and market characteristics. BMC Medicine 13, 230.
- Siler, K, S Haustein, E Smith, V Larivière, JP Alperin. 2018. Authorial and institutional stratification in open access publishing: the case of global health research. PeerJ 6:e4269.
- The STM Report: An overview of scientific and scholarly publishing (50th edition). 2018 (Edited by Johnson, R, A Wilkinson, and M Mabe). International Association of Scientific, Technical and Medical Publishers.
- van Weijen, D. 2012 (Nov). The language of (future) scientific communication. Research Trends 31.
- Ware, M. 2010. Access vs Importance – Powerpoint presentation (Mark Ware and Elsevier research team, October 2010). A global study of nearly 4000 respondents on the importance of and ease of access to professional and academic.
DEVELOPMENT INFO FOR THIS BRIEF
- AUTHOR: Glenn Hampson
- ACKNOWLEDGMENTS: Research work conducted by Eric Archambault and Heather Piwowar are important foundational elements of this brief. Eric and Heather provided comments, as well as Scott Plutchak, Margaret Winker, Claudia Holland, Rick Anderson, Rob Johnson, and Joyce Ogburn
- CONFLICT STATEMENT: The author of this brief is the program director for OSI, which receives funding from foundations, UNESCO, and commercial publishers. This brief has been reviewed and approved by the OSI editorial team and summit leadership group. OSI has many voices contributing to documents such as this brief, and endeavors to maintain an inclusive and balanced perspective on scholarly communication issues.
- DISCLAIMER: This document reflects the input of the author(s) listed here as well as contributions from other OSI participants and the scholarly communication research community. The findings and recommendations expressed herein do not necessarily reflect the opinions of the authors or OSI participants, nor their agencies, trustees, officers, or staff.
- PREVIOUS VERSIONS: (1) https://goo.gl/b3wJJp; (2) https://goo.gl/FUD79D; (3) https://goo.gl/ZWs7gu; (3) http://bit.ly/OSIbrief2
- COPYRIGHT: © 2019 Glenn Hampson. Except where otherwise noted, this article is licensed under a Creative Commons Attribution 4.0 International license.

- CITATION: Hampson, G. 2019. OSI Issue Brief 2 (v. 2): How fast is open growing? Open Scholarship Initiative. http://doi.org/10.13021/osi.v3i0.2368


